Menü
Gel electrophoresis (DNA analysis)
The laboratory practice starts at 7th May, at 14:00 for groups (1-8) and at 16:30 for groups (9-12) in laboratory D311. After the practise the prepared lab report should be left at the end of corridor on the fifth floor (please find „Gel electrophoresis” labeled shelf). Final deadline: 9th May, 12:00.
IMPORTANT! Before the practise, watch videos about „Using a micropipette”, „Running an Agarose Gel” and „Making an Agarose Gel”.
Please take into consideration that the CpAtlas software runs only on Microsoft Windows operation system (do not use Mac OS system).
Practice schedule:
1. Principle of method, setting of system and use of the evaluation software (CpAtlas) are represented by the instructor.
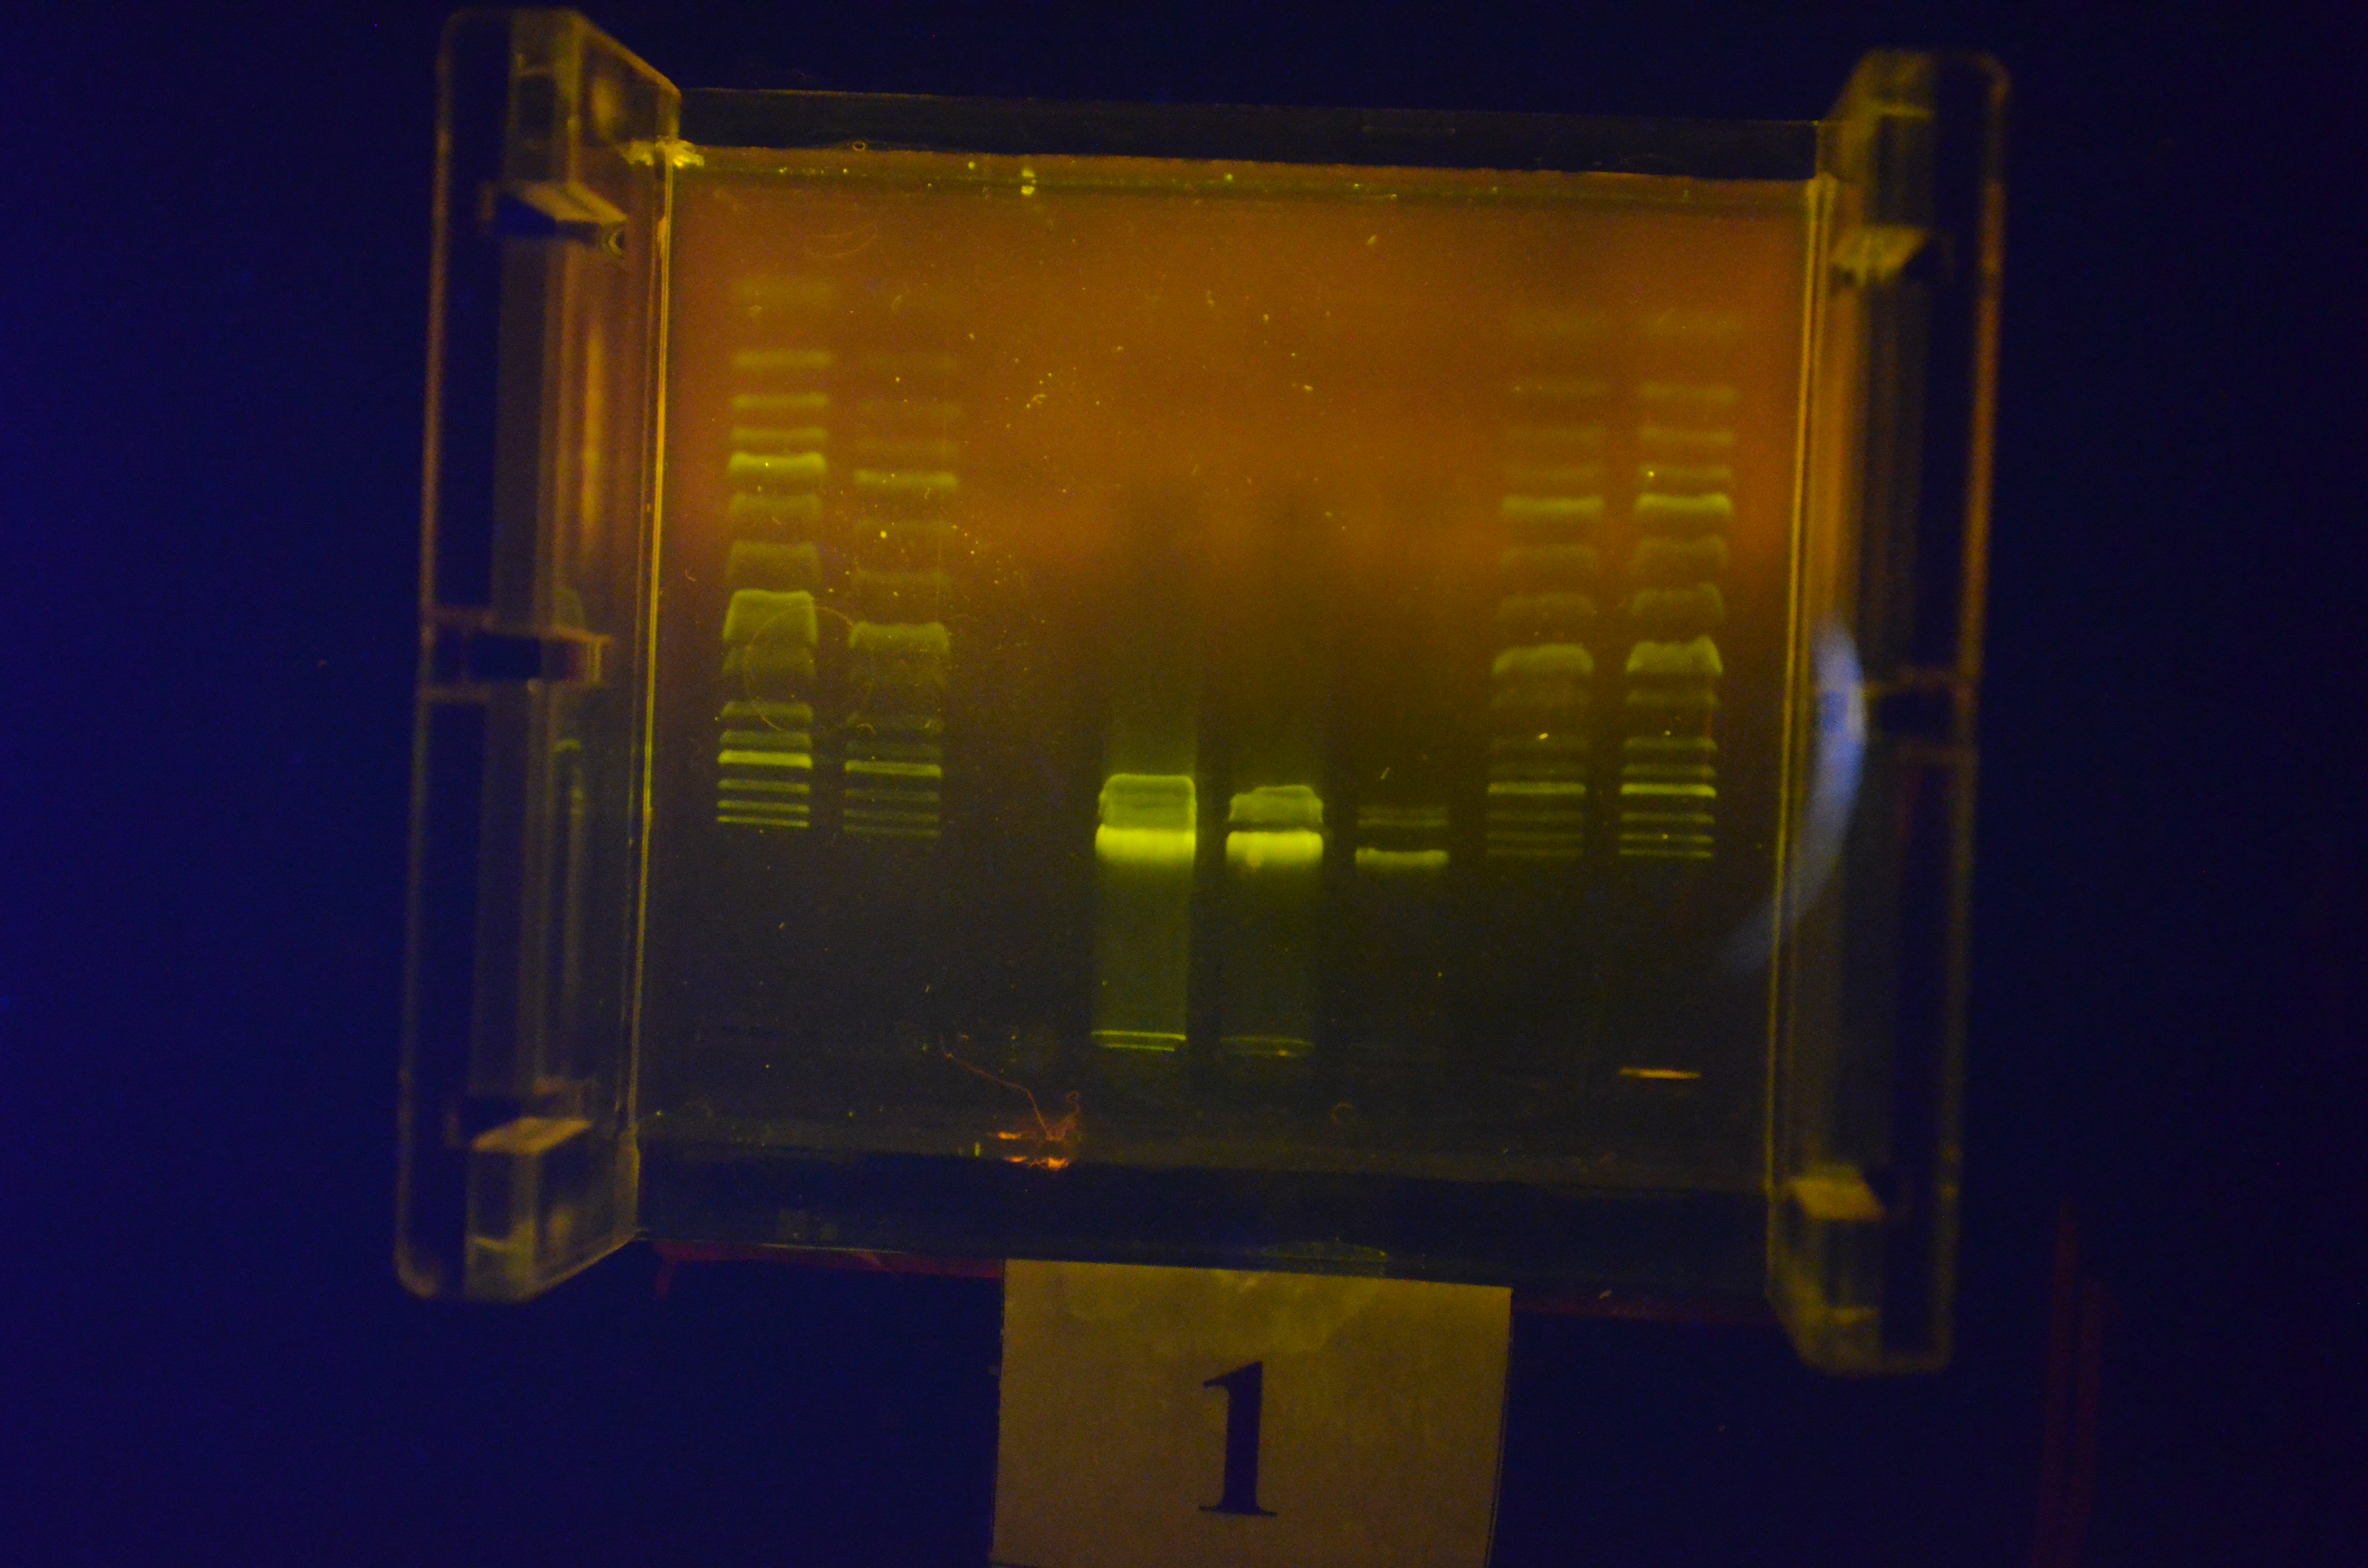
2. During the practise DNA fragments (DNA ladder) are determined by using agarose gel electrophoresis. Every group (contaning 4-5 members) should make one gel and every people should inject 1-2 samples. Unkown samples (2 different) should be made by adding 1 or 0.5 µL stock solution of unknown sample to 4 µL loading dye into an Eppendorf tube. All samples are injected two times into two different wells. Into the wells, 2 µL sample should be injected by using micropipette. After assembling of the electrophoretic apparatus, setting and switching of the high voltage power supply is performed by the instructor. Electrophoretic run takes around 1 hour.
3. Writing short test during the electrophoretic run (~20 minutes).
4. After electrophoresis use the Dark Reader device to visualize the separated bands, take a photo and evaluate with CpAtlas software.
5. EVERY STUDENT HAS TO EVALUATE INDEPENDENTLY the obtained gel photo by using CpAtlas software.
IF TWO OR MORE STUDENTS WOULD USE THE SAME DATA EVALUATION IN THEIR LAB MANUAL, 2 WILL BE THE BEST FINAL MARK THAT THEY MAY OBTAIN!!!
The prepared lab report should contain the gel picture with the selected bands, the thusly obtained and baseline corrected electropherograms, the obtained data (e.g. Rf, area, bp number, log(bp)), calculation and conclusions:
1. Make calibration curve using MS Excel software by plotting logarithm of number of base pairs (bp) of DNA fragments (that means molecular weight) as function of migration distance from the wells (that is the retention factor, Rf). Match linear line to the plotted points and show the equation of the line and the value of R2. Calculate the number of DNA fragments of unknown sample by using the obtained equation.
2. Stick the Excel diagram, electropherograms and data (in table format) obtained by CpAtlas software as well as the gel picture (in small size!) into the lab report.
3. Observe gas formation at electrodes and explain this phenomena with appropriate chemical equations. Discuss how Rf values depends on the number of base pairs (bp) of DNA fragments.
Possible questions in the short test:
1. Principle of electrophoresis
2. Principle of gel electrophoresis
3. Properties of agarose gel
4. Making of agarose gel
5. Visualization of DNA fragments
6. Use of micropipette